General Functionality
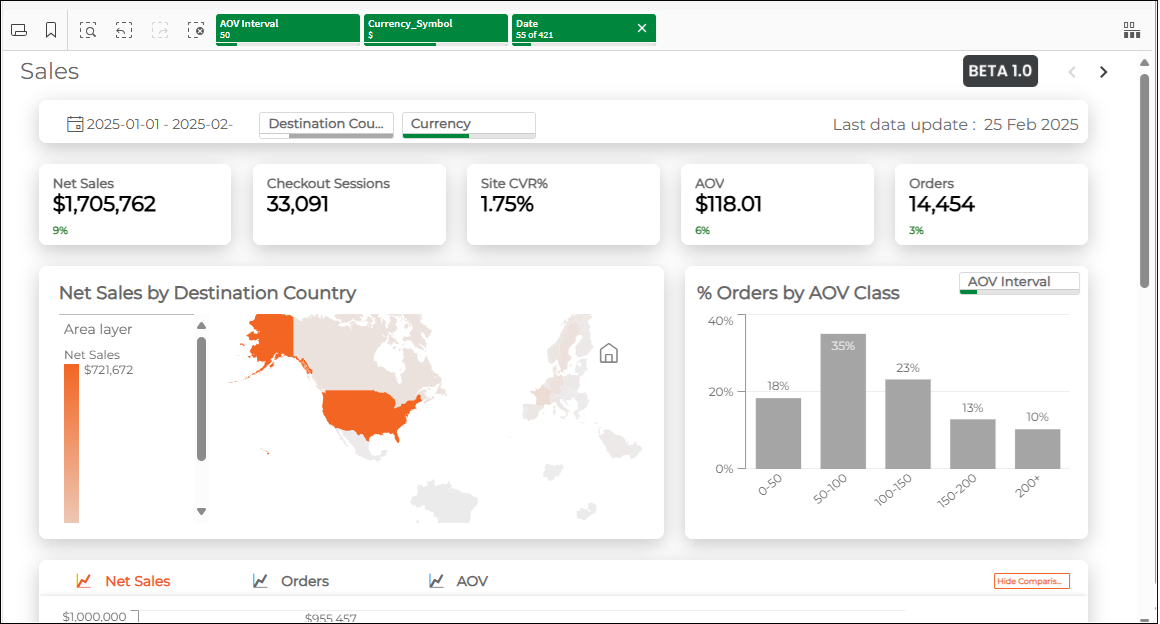
The following screen is displayed when you access Analytics:
From here you can see the following functionality common to all sheets. The following lists describe the following top menu options and Chart options, which you access by right-clicking in one of the metric visualizations:
|
|
The following image shows the location of the top menu and Chart options:
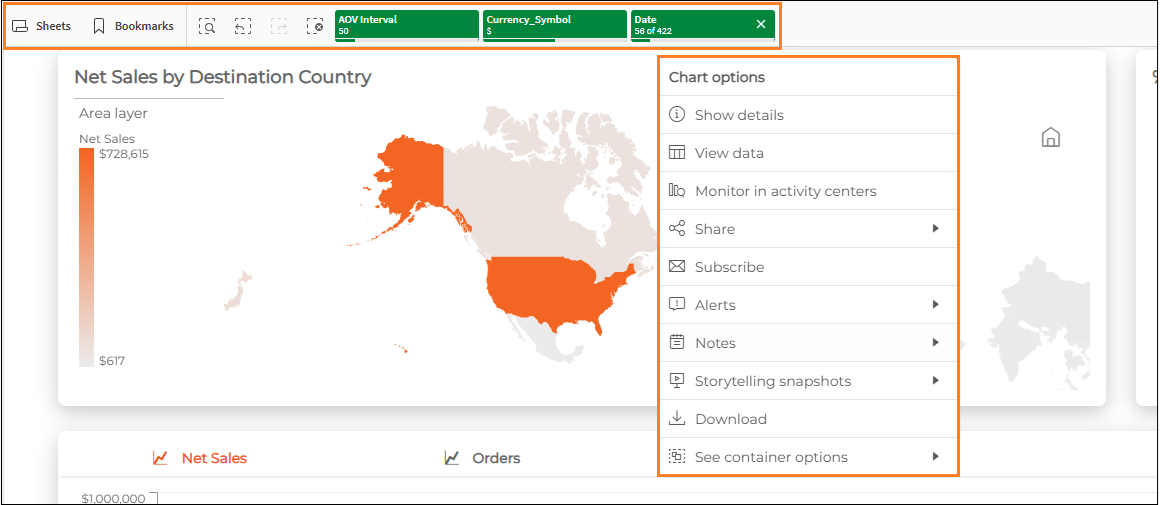
For more information about Chart options, see Tutorial - Beginning with the Basics.
Sheets
The Sheets option shows all public sheets. A sheet is a collection of data about a specific topic.
Common features include the following:
Grid/list view - Toggle between the grid or condensed list views.
Pin/unpin assets - Pin the Assets panel to the screen or unpin to adjust its width.
Full screen/Exit full screen - Expands the Assets panel to its maximum width to easily view its Published and Added timestamp.
You can search all existing sheets using the Search field directly below these functions.
In addition, the ellipsis (three vertical dots) on the right edge of each sheet lets you view more basic details about the sheet and download it as a PDF.
For more information on Qlik's official documentation on sheets, see Sheet View.
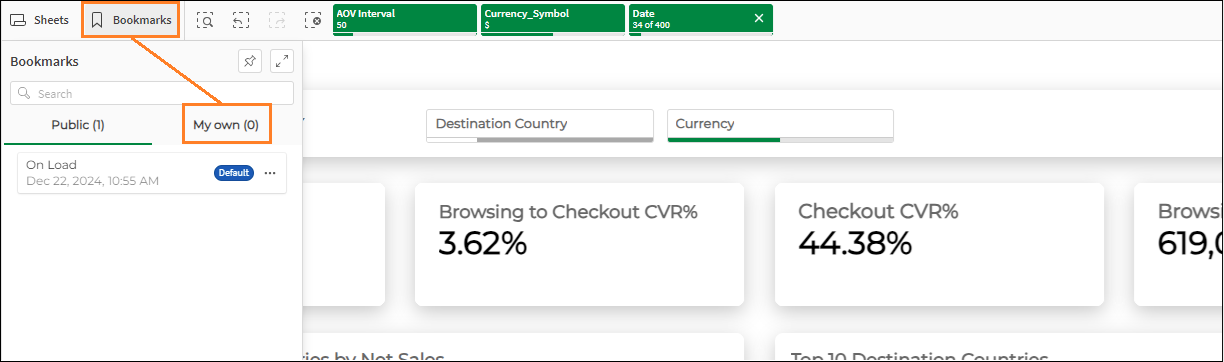
Bookmarks
Bookmarks lets you save specific selections.
In a sheet, make a set of selections that you want to save as a bookmark.
Click Bookmarks.
The Bookmarks panel is displayed.
Select My own.
Click Create new bookmark.
Add a title to the bookmark in the Title field and optional description.
Save/clear the current sheet location:
Save sheet location - Lets you switch to the saved sheet's location when you apply it.
Save layout - Save the sheet settings including its layout, such as the sorting and presentation of charts.
Save all variable states - Save variable states.
For a short tutorial video on using bookmarks, see Bookmarking selections.
In addition, the ellipsis (three vertical dots) on the right edge of each bookmark lets you do the following:
Apply bookmark - Apply both the location and selections of the saved bookmark.
Apply selections only - Apply the selections of the saved bookmark, but not its location.
Details - Shows details about the bookmark, such as its description.
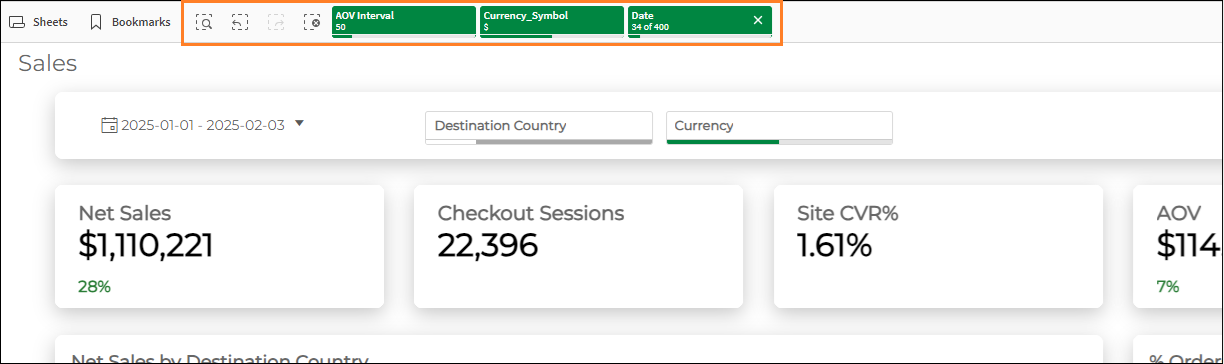
Selection Panel
The Selection Panel has two main functional areas:
The gray navigation squares on the left - used for searching, historical navigation, and clearing selections.
The green tiles on the right - used for showing the dimensions that have selections, and for making certain selections.
The following figure shows the Selection Panel:
The following list describes the navigation buttons:
Smart search - Displays a search field directly below the buttons for searching your data.
Step back - Undoes the most current configuration operation, such as adding the Date configuration.
Step forward - Reapplies the most current configuration operation, such as removing the Date configuration.
Clear all selections - Clears all selections and reverts to the default setting.
The following list describes the default selections:
AOV interval - Adjusts the AOV (Average Order Value) interval shown in the % Orders by AOV Class graph (default value: 50).
Currency symbol and conversion - Converts between the merchant's currency and USD (default value: USD).
Date - Shows the business metrics values based on the selected dates (default value: current year).
For more information on Qlik's official documentation about the Selections Panel, see Exploring with Selections.
Filters
From the Filter you can filter information shown in other areas of Analytics, such as Destination Country and Currency.
The following image shows the filters:
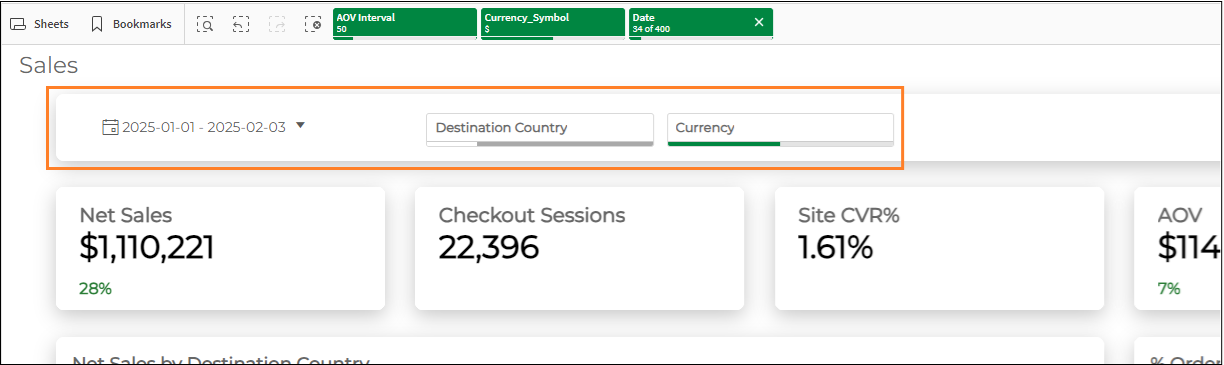
The filter includes the following:
Date range - Lets you select the date range of the shown data with built-in selections for the previous day, last seven days, last 30 days, current year, and last 12 months. The default date range selection is year-to-date.
Destination Country - Lets you select a country or countries.
Clicking the ellipsis located directly above the list of countries reveals the following sub-options:
Select all - Selects the entire list of countries.
Select possible - Selects all possible countries. Disabled countries (shown as grey) indicate countries with no data, such as a selected date range outside of which the selected countries generated no sales.
Select alternative - Selects the inverse of the countries that you've manually selected.
Select excluded - Selects all excluded countries. This should be used to exclude dates related to anomalous data, such as outlying spikes in sales for a singular date.
Clear selection - Clears all of your selections.
Cancel selection - Closes the selection menu.
Confirm selection - Confirms and applies your selection, which is reflected in the relevant values in the Business Metrics panel.
Currency - Lets you select a currency (available for non-USD merchants only).
Selecting a different currency affects all business metrics with monetary value.
Alerts
From the Alerts section you can do the following:
Creating Alerts
Right-click while in a metric visualization area, such as Net Sales by Destination Country.
From the menu, click Alerts.
Click Create new alert.
The Create alert window is displayed.
Fill out the Title and Description of the alert in the Details section.
Add the following to the alert in the Add data to the alert section:
A measure or measures - defines the measure or measures that the alert applies to
Dimension - splits up the measure per dimension for a more specific result
Selections - sets which selections to use in the data alert
Preview the data that you've selected to monitor in the Data preview section and modify if needed.
Click Next.
Add the required conditions in the Condition 1 section:
Measure or dimension
Operator
Compare with
Value
Optional - Add an additional condition by clicking Add additional condition.
Do the following in the Schedule section:
Define the alert refresh frequency in the Evaluate the alert region.
Define the amount of times per day to receive an alert notification in the Times per day region.
Set your timezone in the Timezone region.
Set the time of day in your timezone in the Time of day region.
Set the alert duration schedule in the Run this schedule region.
Set the snooze notification frequency in the Snooze notifications section.
Optional - Set the recipients to share the alert notifications with in the Share with other users section.
You will receive an alert even if you do not define a recipient or recipients.
Click Create.
For more information, see Monitoring data with alerts.
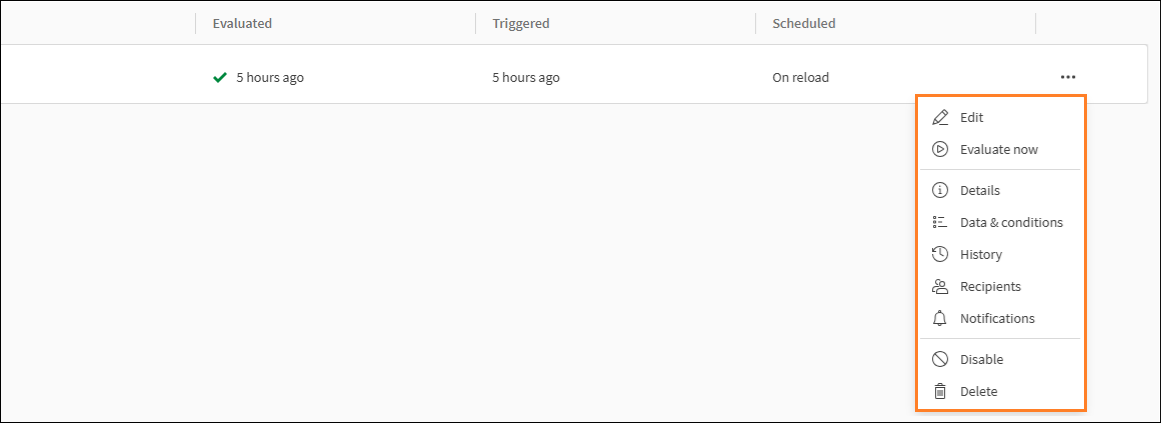
Managing Alerts
Once you've created an alert or alerts, you can manage them. Managing alerts lets you view and edit alert details.
Follow steps 1 and 2 in Creating Alerts above.
Click Manage alerts in the lower left corner of the Create alert window.
Optional - Filter the alerts from the menu in the top left corner.
Alert owners can add or remove recipients. Non-owners can remove alerts.
Optional - Sort the alerts from the menu in the top right corner.
Review your alert settings by clicking the ellipsis at the right end of the row,
For more information, see Monitoring data with alerts.
Unsubscribing from an Alert
If needed, you can unsubscribe users from or delete alerts. Only alert owners can delete alerts, while others can only unsubscribe from them.
Alert owners have the following additional options:
Follow steps 1 through 3 in Creating Alerts above.
Click Manage alerts in the lower left corner of the Create alert window.
Click the ellipsis at the right end of the row corresponding to a subscription and click Unsubscribe or Delete.
For more information, see Monitoring data with alerts.
Editing Alerts
Once you've created an alert or alerts, you can edit them.
Right-click while in a metric visualization area, such as Net Sales by Destination Country.
From the menu, click Alerts.
Click the created alert title.
Edit your alert settings in the Edit alert window.
Click Next until you reach the final window and click Save.
For help about alerts, in the Create alert or Edit alert window click the ellipsis and then Help.
Subscriptions
From the Subscriptions section you can do the following:
Creating Subscriptions
Right-click while in a metric visualization area, such as Net Sales by Destination Country.
From the menu, click Subscriptions.
The Subscribe window is displayed.
Set the following in the Subscribe section:
Title - type a title
Description - type a description
Format - select a format
Data - toggle the data switch on or off
Set the frequency for sending emails in the Send email section.
Set the time of day to send emails.
Optional - Set the recipients to subscribe in the Share with others section.
Click Preview to download a preview of your subscription in PDF format.
Click Subscribe.
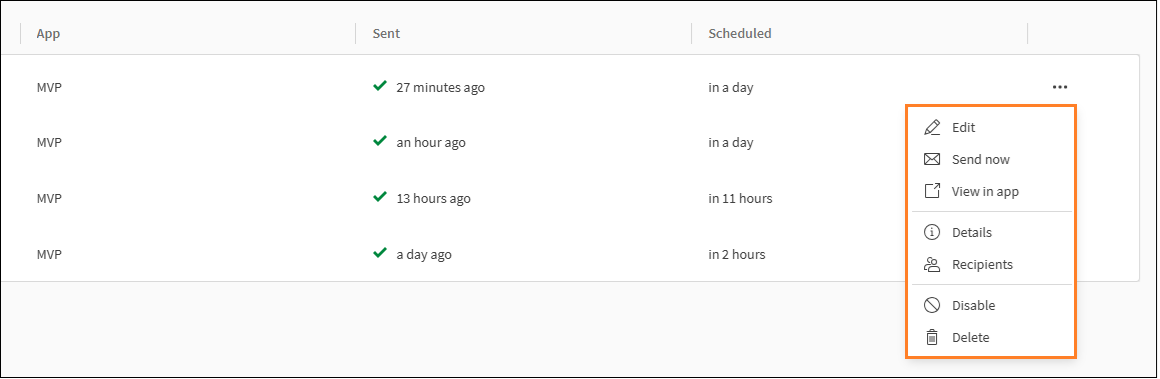
Managing Subscriptions
Once you've created a subscription or subscriptions, you can manage them. Managing subscriptions lets you easily review your alert settings, such as details and data conditions.
Follow steps 1 and 2 in Creating Subscriptions above.
Click Manage subscriptions in the lower left corner of the Create subscriptions window.
Optional - Filter the subscriptions from the menu in the top left corner.
Optional - Sort the subscriptions from the menu in the top right corner.
Review your subscription settings by clicking the ellipsis at the right end of the row:
View in app
Details
Unsubscribe
Unsubscribing from or Deleting a Subscription
If needed, you can unsubscribe users from or delete subscriptions. Only subscription owners can delete subscriptions, while others can only unsubscribe from them.
Subscription owners have the following additional options:
Follow steps 1 through 2 in Creating Subscriptions above.
Click Manage subscriptions in the lower left corner of the Subscribe window.
Click the ellipsis at the right end of the row corresponding to a subscription and click Unsubscribe or Delete.
Editing Subscriptions
Once you've created a subscription or subscriptions, you can edit them. You can only edit subscriptions that you've created.
Right-click while in a metric visualization area, such as Net Sales by Destination Country.
From the menu, click Subscriptions.
The Subscribe window is displayed.
Click Manage subscriptions in the lower left corner of the Create subscriptions window.
Click the ellipsis at the right end of the row corresponding to your subscription and click Edit.
Edit your subscription settings in the Edit subscription window.
Click Save.