Reports
Setting Up Fixed Prices in Magento
The Reconciliation Report provides a comprehensive detail of all your sales. It is generated automatically once a week and continually monitored by the Global-e finance team.
The Reconciliation Report is sent to you by email each week.
The Reconciliation Report is presented in your local currency, and the information is aligned with the rules and regulations of your specific country.
A detailed Reconciliation Report contains:
A breakdown of each order by product, including a breakdown of cart and product discounts.
A summary of all orders dispatched during the period.
A summary of all related shipping and Duties and Taxes costs and subsidies.
A summary of refunds issued within the period, and a breakdown of these refunds by product.
A summary of all returns costs and subsidies for returns that took place during the period.
A summary of all totals in the report for ease of invoicing.
A separate tab is available near the bottom of the page for each of the above.
Important
With each report:
The Sales Total serves as the basis for the service fee calculation each week.
Orders are included for reconciliation according to the Received In Hub date and refunds by their creation date.
Accessing Your Reconciliation Report
This page tells you how to:
View your Reconciliation Report
View your Reconciliation Report details
Download your Reconciliation Report
Print your Reconciliation report
Navigate to Merchants > Reports > Reconciliation Report from the top menu.
Select a merchant from the Merchant menu.
Select a date period from the Report menu.
The Reconciliation Report page is displayed showing a summary of the latest billing period.
Follow steps 1 - 3 above.
At the bottom of your report, click one of the following tabs to view more activity details for the selected period:
Products
Orders
ShippingPerParcel
Refunds
RefundsComponents
Returns
Service Free
See ??? for more information about the above.
Follow steps 1 - 3 in To view your Reconciliation Report.
In the bottom-left corner of the page, click Download Report.
Follow steps 1 -3 in To view your Reconciliation Report.
In the bottom-right corner of the page, click Print.
Note
You can select the Show all Pro merchants option to show all Pro merchants located below the Print button.
The reconciliation report is presented in your local (merchant) currency, and the information is aligned with the rules and regulations of your specific country.
Issuing Reconciliation Reports
From this screen you can view your reconciliation reports.
From the top menu, navigate to Merchants > Reports.
From the Merchant menu, select a merchant.
From the Report menu, select a week range.
The reconciliation report is displayed in the region below the dropdown menu. Note that the reconciliation report has several tabs containing different reconciliation information.
Downloading and Printing Reconciliation Reports
From this screen you can also download or print your reconciliation reports or invoices by doing one or more of the following:
Downloading your report by clicking Download Report.
Printing your report by clicking Print.
Downloading an invoice of your report by clicking Invoice.
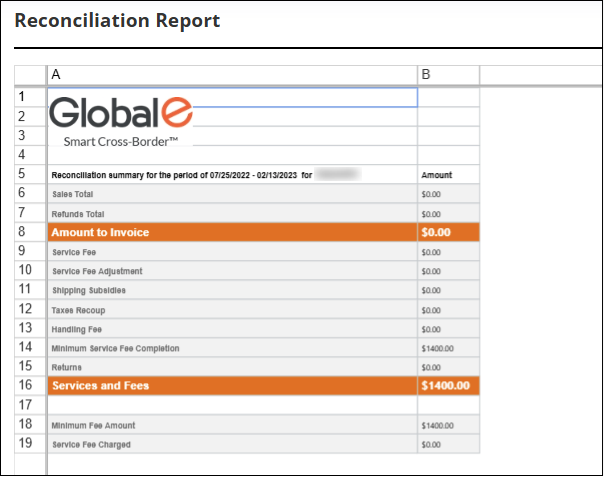
Reconciliation Report Breakdown
Below is a sample Reconciliation Report with a breakdown of the services and fees for the selected week.
Amount Excl. VAT | VAT | Amount Incl. VAT | ||
|---|---|---|---|---|
Sales Total | £23528.85 | £4705.77 | £28234.62 | |
Refunds Total | (£2106.68) | (£423.79) | (£2530.47) | |
Amount to Invoice | £21422.17 | £4281.98 | £25704.15 | |
Service Fee | £1899.44 | £379.89 | £2279.33 | 7.50% of Total Order Value |
Shipping Subsidies | £3,649.75 | £0.00 | £3,649.75 | |
Taxes Subsidization | £1114.45 | £0.00 | £1114.45 | |
Handling Fee | £140.00 | £28.00 | £168.00 | |
Returns | £14.97 | £2.99 | £17.96 | |
Services and Fees | £6818.61 | £410.88 | £7229.49 |
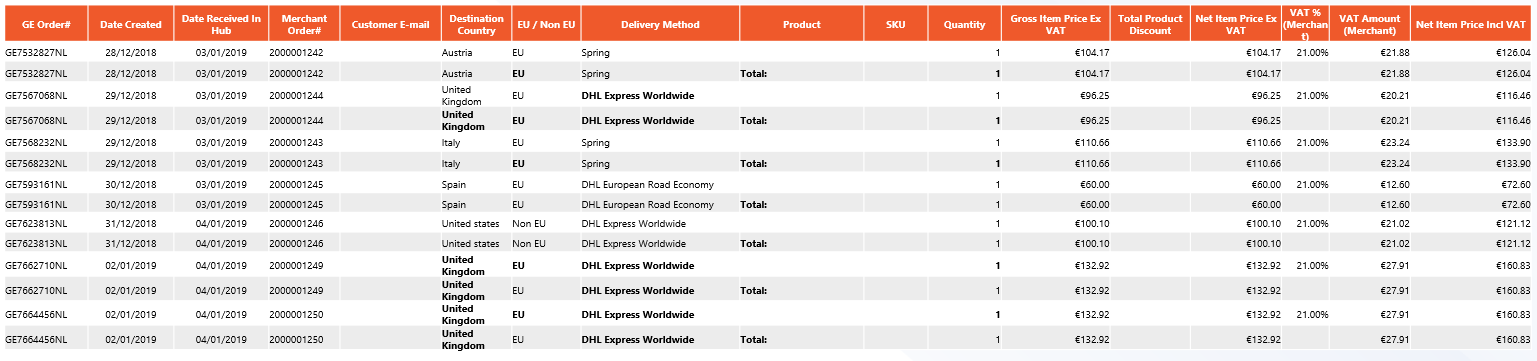
Sales Total
The following figures show the Sales total on the order and product levels:
Order Level
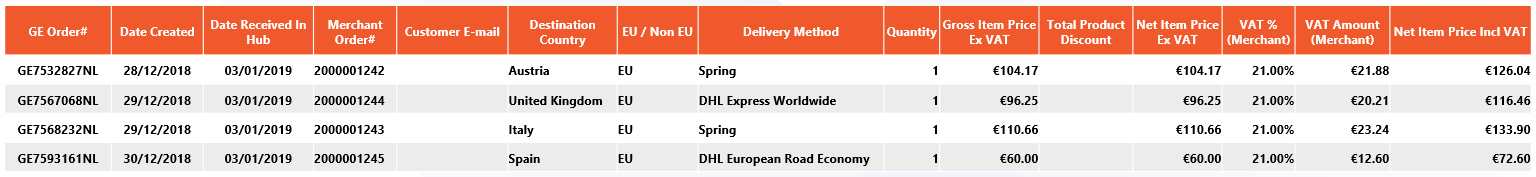
Product Level
Refunds Total
The following figure shows the Refunds total, listing all the refunds that were issued through Global-e during the relevant period:

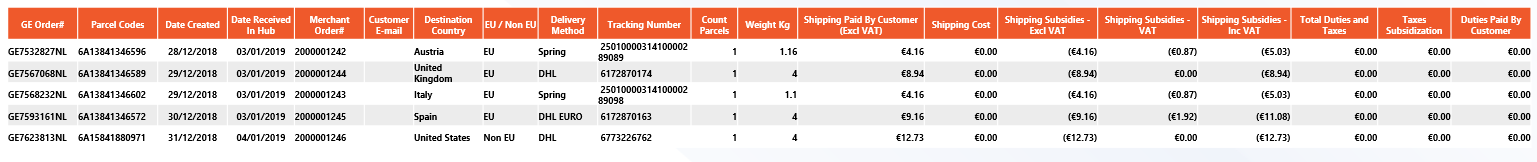
Shipping Subsidies
Shipping prices are based on the actual weight that we received from the shipper or measured at our hub. Shipping costs are reconciled based on the shipment date. The following figure shows the Shipping subsidies:
Returns
Returns includes the details of each returned parcel. The following figure shows the Returns:

To understand the reconciliation report using your own logistics (WYOL) click here.
For a list of all the report fields and their definitions, see Reconciliation Report Fields.
Reconciliation Report
The Reconciliation Report Explained
The following video explains the structure of the weekly reconciliation report.